Benchmark Problems for Acoustical Parameters
Basic: B-31
Find values of Speech Transmission Index (STI) from speech level (background noise included), background noise level, and impulse response.
Results of level measurement
| Frequency (Hz) | 125 | 250 | 500 | 1000 | 2000 | 4000 | 8000 |
| Speech level (dB) (background noise included) | 67 | 67 | 64 | 58 | 52 | 46 | 40 |
| Background noise level (dB) | 48 | 40 | 34 | 30 | 27 | 25 | 23 |
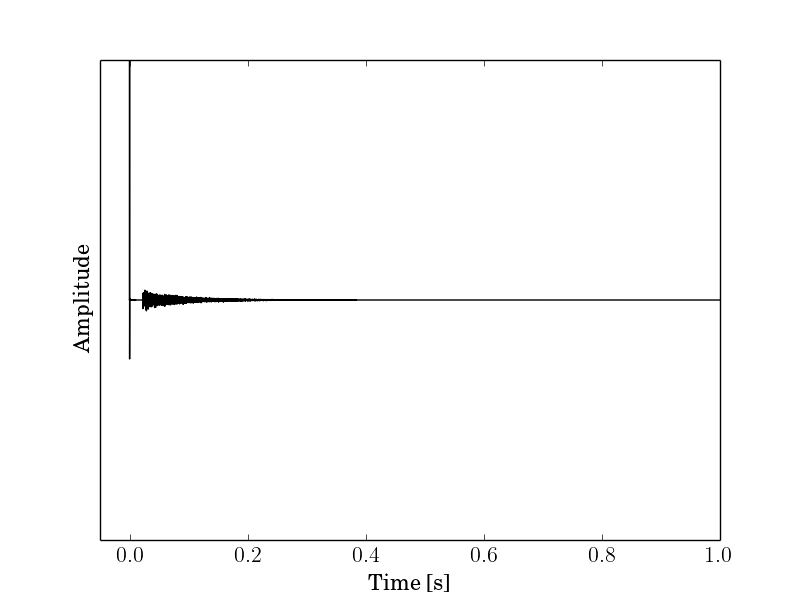
Impulse response
b31.wav (RIFF waveform, 16 bit signed integer, monoral, sampling frequency: 48000 Hz)b31.fb (floating-point binary (little endian), 288000 data, monoral, sampling frequency: 48000 Hz)
Note
This impulse response is modified white noise to decay the energy exponentially and to fit about 0.5 second reverberation time.STI
| STI | |
| Hoshi | 0.311 |
| Nishikawa | 0.311 |
| Okubo | 0.310 |
Calculation Procedure (complying with IEC60268-16:2020 Edition 5)
| Step | Item | Modulation frequency $f_m$ (Hz) |
Frequency $f_k$ (Hz) | Note | ||||||
| 125 | 250 | 500 | 1000 | 2000 | 4000 | 8000 | ||||
| 1 | $L_k$ – Combined speech and noise level (dB) | 67 | 67 | 64 | 58 | 52 | 46 | 40 | Measure the speech levels (background noise included) in a real space under the circumstances where the artifical noise which has the frequency response of male's voice shown in Table A.4 is exposed. The exposed noise should be equalized and adjusted with Normal: 60 dB or Raised: 66 dB A-weighted levels at 1 meter far from a source point. | |
| 2 | $L_{N,k}$ – Background noise level (dB) | 48 | 40 | 34 | 30 | 27 | 25 | 23 | Measure the background (ambient) noise levels | |
| 3 | $m_{k,\,f_m}$ – Modulation transfer fuction (MTF) calculated from impulse response | 0.63 | 0.997 69 | 0.996 51 | 0.997 12 | 0.997 02 | 0.997 30 | 0.997 17 | 0.994 28 | Compute MTF from octave-filtered impulse response $\small{h_k(t)}$ and modulation frequency $\small{f_m}$. \[ m_{k,\,f_m} = \frac{\left| \int \limits^{\infty}_{0} h^\textsf{2}_k (t)\,\exp (-j\textsf{2} \pi f_m t)\,\textsf{d}t \right|}{\int\limits^{\infty}_{\textsf{0}}h^\textsf{2}_k (t)\,\textsf{d}t} \] |
| 0.8 | 0.996 31 | 0.994 44 | 0.995 40 | 0.995 26 | 0.995 69 | 0.995 49 | 0.990 88 | |||
| 1 | 0.994 32 | 0.991 44 | 0.992 94 | 0.992 71 | 0.993 39 | 0.993 07 | 0.985 99 | |||
| 1.25 | 0.991 34 | 0.986 94 | 0.989 25 | 0.988 90 | 0.989 94 | 0.989 45 | 0.978 65 | |||
| 1.6 | 0.986 38 | 0.979 45 | 0.983 15 | 0.982 61 | 0.984 25 | 0.983 49 | 0.966 50 | |||
| 2 | 0.979 83 | 0.969 66 | 0.975 24 | 0.974 43 | 0.976 88 | 0.975 75 | 0.950 66 | |||
| 2.5 | 0.970 78 | 0.956 39 | 0.964 61 | 0.963 46 | 0.967 01 | 0.965 36 | 0.929 27 | |||
| 3.15 | 0.958 28 | 0.938 96 | 0.950 71 | 0.949 20 | 0.954 16 | 0.951 77 | 0.901 09 | |||
| 4 | 0.941 77 | 0.918 28 | 0.933 92 | 0.932 52 | 0.938 89 | 0.935 40 | 0.866 92 | |||
| 5 | 0.923 57 | 0.899 27 | 0.917 20 | 0.917 52 | 0.924 39 | 0.919 53 | 0.833 30 | |||
| 5.3 | 0.903 34 | 0.884 22 | 0.900 28 | 0.905 59 | 0.911 23 | 0.905 03 | 0.800 53 | |||
| 8 | 0.882 69 | 0.878 28 | 0.885 35 | 0.898 58 | 0.901 35 | 0.895 21 | 0.773 08 | |||
| 10 | 0.868 97 | 0.877 88 | 0.877 15 | 0.895 38 | 0.897 01 | 0.891 48 | 0.759 21 | |||
| 12.5 | 0.868 75 | 0.866 70 | 0.878 97 | 0.894 79 | 0.900 34 | 0.890 17 | 0.758 89 | |||
| 4 | $L_{S,k}$ – Signal Level (dB) | 66.944 98 | 66.991 33 | 63.995 65 | 57.993 11 | 51.986 24 | 45.965 37 | 39.912 47 | Compute $\small{L_{S,k}}$ from $\small{L_k}$ and $\small{L_{N,k}}$. \[ L_{S,k} = \textsf{10} \log _{\textsf{10}}\left[\textsf{10}^{(L_{k}/\textsf{10})}- \textsf{10}^{(L_{N,k}/\textsf{10})}\right] \] | |
| 5 | $\rho_k$ – Ratio of signal to background noise level (dB) | 18.944 98 | 26.991 33 | 29.995 65 | 27.993 11 | 24.986 24 | 20.965 37 | 16.912 47 | \[ \rho_k = L_{S,k} - L_{N,k} \] | |
| 6 | Correction factor for background (ambient) noise | 0.987 41 | 0.998 00 | 0.999 00 | 0.998 42 | 0.996 84 | 0.992 06 | 0.980 05 | \[ \left[ \textsf{1}+\textsf{10}^{-\rho_k /\textsf{10}} \right]^{-\textsf{1}} = \frac{I_{S,k}}{I_{S,k}+I_{N,k}} = \frac{I_{S,k}}{I_{k}} \] | |
| 7 | $m^{\prime}_{k,\,f_m}$ – Ajusted MTF with background noise | 0.63 | 0.985 13 | 0.994 52 | 0.996 12 | 0.995 44 | 0.994 14 | 0.989 25 | 0.974 44 | \begin{align*} m^{\prime}_{k,\,f_m} &= m_{k,\,f_m} \cdot\left[ \textsf{1}+\textsf{10}^{-\rho_k /\textsf{10}} \right]^{-\textsf{1}} \\ &= m_{k,\,f_m} \times \frac{I_{S,k}}{I_{S,k}+I_{N,k}} \end{align*} |
| 0.8 | 0.983 77 | 0.992 45 | 0.994 41 | 0.993 68 | 0.992 55 | 0.987 58 | 0.971 11 | |||
| 1 | 0.981 81 | 0.989 46 | 0.991 94 | 0.991 14 | 0.990 25 | 0.985 18 | 0.966 31 | |||
| 1.25 | 0.978 86 | 0.984 97 | 0.988 26 | 0.987 34 | 0.986 81 | 0.981 59 | 0.959 12 | |||
| 1.6 | 0.973 96 | 0.977 50 | 0.982 17 | 0.981 05 | 0.981 14 | 0.975 67 | 0.947 21 | |||
| 2 | 0.967 50 | 0.967 72 | 0.974 27 | 0.972 89 | 0.973 79 | 0.968 00 | 0.931 69 | |||
| 2.5 | 0.958 56 | 0.954 48 | 0.963 65 | 0.961 93 | 0.963 95 | 0.957 69 | 0.910 73 | |||
| 3.15 | 0.946 22 | 0.937 09 | 0.949 76 | 0.947 70 | 0.951 14 | 0.944 21 | 0.883 11 | |||
| 4 | 0.929 91 | 0.916 45 | 0.932 99 | 0.931 05 | 0.935 92 | 0.927 97 | 0.849 63 | |||
| 5 | 0.911 95 | 0.897 48 | 0.916 29 | 0.916 06 | 0.921 47 | 0.912 22 | 0.816 67 | |||
| 5.3 | 0.891 97 | 0.882 46 | 0.899 38 | 0.904 15 | 0.908 35 | 0.897 84 | 0.784 55 | |||
| 8 | 0.871 58 | 0.876 53 | 0.884 46 | 0.897 16 | 0.898 50 | 0.888 10 | 0.757 65 | |||
| 10 | 0.858 03 | 0.876 13 | 0.876 28 | 0.893 97 | 0.894 18 | 0.884 40 | 0.744 06 | |||
| 12.5 | 0.857 82 | 0.864 97 | 0.878 09 | 0.893 38 | 0.897 49 | 0.883 10 | 0.743 74 | |||
| 8 | $I_k$ - Intensity of speech and noise | 5 011 872 | 5 011 872 | 2 511 886 | 630 957 | 158 489 | 39 811 | 10 000 | \[ I_k = \textsf{10}^{(L_k/\textsf{10})} \] | |
| 9 | $L_{a,k}$ - Levels of auditory masking factor (dB) | - | -26.3 | -26.3 | -31.7 | -36 | -39 | -42 | Determine the values of $\small{L_{a,k}}$ from Table A.3 without 125 Hz | |
| 10 | $a_k$ – Auditory masking factor | - | 0.002 34 | 0.002 34 | 0.000 68 | 0.000 25 | 0.000 13 | 0.000 06 | Ommit 125 Hz. \[ a_{k} = \textsf{10}^{(L_{a,k}/\textsf{10})} \] | |
| 11 | $I_{am,k}$ – Auditory masking Intensity | 0 | 11748.976 | 11748.976 | 1698.2437 | 158.48932 | 19.953 | 2.5119 | The value of 125 Hz determines zero. \[ I_{am,k} = a_k \times I_{k-\textsf{1}} \] | |
| $A_k$ – Level of the absolute reception threshold (dB) | 46 | 27 | 12 | 6.5 | 7.5 | 8 | 12 | Refer Table A.2. | ||
| 12 | $I_{\textsf{rt},k}$ - Intensity of the absolute reception threshold | 39810.72 | 501.19 | 15.85 | 4.47 | 5.62 | 6.31 | 15.85 | \[ I_{\textsf{rt},k} = \textsf{10}^{(A_k/\textsf{10})} \] | |
| 13 | Intensity ratio correction factor $C_k$ | 0.992 12 | 0.997 56 | 0.995 34 | 0.997 31 | 0.998 97 | 0.999 34 | 0.998 17 | \[ C_k = \frac{I_k}{I_k+I_{am,k}+I_{\textsf{rt},k}} \] | |
| 14 | $m^{\prime\prime}_{k,\,f_m}$ – Adjusted MTF with masking factor | 0.63 | 0.977 36 | 0.992 10 | 0.991 47 | 0.992 76 | 0.993 12 | 0.988 59 | 0.972 65 | \[ m^{\prime\prime}_{k,\,f_m} = m^{\prime}_{k,\,f_m} \times C_k \] |
| 0.8 | 0.976 01 | 0.990 03 | 0.989 77 | 0.991 00 | 0.991 52 | 0.986 93 | 0.969 33 | |||
| 1 | 0.974 07 | 0.987 05 | 0.987 32 | 0.988 47 | 0.989 22 | 0.984 53 | 0.964 54 | |||
| 1.25 | 0.971 15 | 0.982 57 | 0.983 65 | 0.984 68 | 0.985 79 | 0.980 95 | 0.957 37 | |||
| 1.6 | 0.966 28 | 0.975 11 | 0.977 59 | 0.978 41 | 0.980 12 | 0.975 03 | 0.945 48 | |||
| 2 | 0.959 87 | 0.965 36 | 0.969 72 | 0.970 27 | 0.972 78 | 0.967 36 | 0.929 98 | |||
| 2.5 | 0.951 01 | 0.952 15 | 0.959 16 | 0.959 34 | 0.962 95 | 0.957 06 | 0.909 06 | |||
| 3.15 | 0.938 76 | 0.934 80 | 0.945 33 | 0.945 15 | 0.950 16 | 0.943 58 | 0.881 49 | |||
| 4 | 0.922 58 | 0.914 21 | 0.928 64 | 0.928 54 | 0.934 95 | 0.927 36 | 0.848 07 | |||
| 5 | 0.904 76 | 0.895 29 | 0.912 01 | 0.913 60 | 0.920 52 | 0.911 62 | 0.815 18 | |||
| 5.3 | 0.884 94 | 0.880 30 | 0.895 19 | 0.901 72 | 0.907 41 | 0.897 25 | 0.783 12 | |||
| 8 | 0.864 71 | 0.874 39 | 0.880 34 | 0.894 75 | 0.897 57 | 0.887 52 | 0.756 27 | |||
| 10 | 0.851 27 | 0.874 00 | 0.872 19 | 0.891 56 | 0.893 25 | 0.883 82 | 0.742 70 | |||
| 12.5 | 0.851 06 | 0.862 86 | 0.874 00 | 0.890 97 | 0.896 56 | 0.882 52 | 0.742 38 | |||
| 15 | $\rho_{\textsf{eff}_ {k,\,f_m}}$ – Convert MTF values into effective SNRs (dB) | 0.63 | 15.000 00 | 15.000 00 | 15.000 00 | 15.000 00 | 15.000 00 | 15.000 00 | 15.000 00 | -15 ≤ $\small{\rho_{\textsf{eff}_{k,\,f_m}}}$ ≤ +15 に収める。 \[ \rho_{\textbf{eff}\,_{k,\,f_m}}=\textsf{10} \log_{\textsf{10}}\left( \frac{m^{\prime\prime}_{k,\,f_m}}{\textsf{1}-m^{\prime\prime}_{k,\,f_m}} \right) \] |
| 0.8 | 15.000 00 | 15.000 00 | 15.000 00 | 15.000 00 | 15.000 00 | 15.000 00 | 14.997 46 | |||
| 1 | 15.000 00 | 15.000 00 | 15.000 00 | 15.000 00 | 15.000 00 | 15.000 00 | 14.346 15 | |||
| 1.25 | 15.000 00 | 15.000 00 | 15.000 00 | 15.000 00 | 15.000 00 | 15.000 00 | 13.513 26 | |||
| 1.6 | 14.572 51 | 15.000 00 | 15.000 00 | 15.000 00 | 15.000 00 | 15.000 00 | 12.390 64 | |||
| 2 | 13.787 67 | 14.451 47 | 15.000 00 | 15.000 00 | 15.000 00 | 14.718 26 | 11.232 71 | |||
| 2.5 | 12.880 61 | 12.988 70 | 13.707 75 | 13.728 40 | 14.148 48 | 13.480 85 | 9.998 27 | |||
| 3.15 | 11.855 11 | 11.564 84 | 12.378 57 | 12.363 02 | 12.801 94 | 12.233 84 | 8.714 68 | |||
| 4 | 10.761 77 | 10.276 14 | 11.143 71 | 11.137 34 | 11.575 44 | 11.060 71 | 7.467 84 | |||
| 5 | 9.777 06 | 9.319 86 | 10.155 87 | 10.242 19 | 10.637 64 | 10.134 78 | 6.444 93 | |||
| 5.3 | 8.859 96 | 8.665 56 | 9.315 06 | 9.625 94 | 9.912 21 | 9.411 14 | 5.576 00 | |||
| 8 | 8.056 19 | 8.426 93 | 8.667 04 | 9.294 61 | 9.426 24 | 8.970 85 | 4.917 57 | |||
| 10 | 7.576 79 | 8.411 26 | 8.340 49 | 9.149 58 | 9.226 11 | 8.812 22 | 4.603 67 | |||
| 12.5 | 7.569 37 | 7.987 80 | 8.411 36 | 9.123 26 | 9.379 04 | 8.757 54 | 4.596 51 | |||
| 16 | $TI_{k,\,f_m}$ – Convert trancateed $\rho$ values into transmission indices | 0.63 | 1.000 00 | 1.000 00 | 1.000 00 | 1.000 00 | 1.000 00 | 1.000 00 | 1.000 00 | 0 ≤ TI ≤ +1 \[ TI_{k,\,f_m} = \frac{\rho_{\textbf{eff}\,_{k,\,f_m}}+\textsf{15}}{\textsf{30}} \] |
| 0.8 | 1.000 00 | 1.000 00 | 1.000 00 | 1.000 00 | 1.000 00 | 1.000 00 | 0.999 92 | |||
| 1 | 1.000 00 | 1.000 00 | 1.000 00 | 1.000 00 | 1.000 00 | 1.000 00 | 0.978 20 | |||
| 1.25 | 1.000 00 | 1.000 00 | 1.000 00 | 1.000 00 | 1.000 00 | 1.000 00 | 0.950 44 | |||
| 1.6 | 0.985 75 | 1.000 00 | 1.000 00 | 1.000 00 | 1.000 00 | 1.000 00 | 0.913 02 | |||
| 2 | 0.959 59 | 0.981 72 | 1.000 00 | 1.000 00 | 1.000 00 | 0.990 61 | 0.874 42 | |||
| 2.5 | 0.929 35 | 0.932 96 | 0.956 92 | 0.957 61 | 0.971 62 | 0.949 36 | 0.833 28 | |||
| 3.15 | 0.895 17 | 0.885 49 | 0.912 62 | 0.912 10 | 0.926 73 | 0.907 79 | 0.790 49 | |||
| 4 | 0.858 73 | 0.842 54 | 0.871 46 | 0.871 24 | 0.885 85 | 0.868 69 | 0.748 93 | |||
| 5 | 0.825 90 | 0.810 66 | 0.838 53 | 0.841 41 | 0.854 59 | 0.837 83 | 0.714 83 | |||
| 5.3 | 0.795 33 | 0.788 85 | 0.810 50 | 0.820 86 | 0.830 41 | 0.813 70 | 0.685 87 | |||
| 8 | 0.768 54 | 0.780 90 | 0.788 90 | 0.809 82 | 0.814 21 | 0.799 03 | 0.663 92 | |||
| 10 | 0.752 56 | 0.780 38 | 0.778 02 | 0.804 99 | 0.807 54 | 0.793 74 | 0.653 46 | |||
| 12.5 | 0.752 31 | 0.766 26 | 0.780 38 | 0.804 11 | 0.812 63 | 0.791 92 | 0.653 22 | |||
| 17 | $MTI_k$ – Compute mean transmission indices | 0.894 52 | 0.897 84 | 0.909 81 | 0.915 87 | 0.921 68 | 0.910 91 | 0.818 57 | \[ MTI_k = \frac{\textsf{1}}{\textsf{14}}\sum^{\textsf{14}}_{m=\textsf{1}}TI_{k,\,f_m} \] | |
| Weighting factors of Male voice | α | 0.085 | 0.127 | 0.230 | 0.233 | 0.309 | 0.224 | 0.173 | Refer Table A.1. | |
| β | 0.085 | 0.078 | 0.065 | 0.011 | 0.047 | 0.095 | - | |||
| 18 | STI | 0.902 | \[ STI = \sum^\textsf{7}_{k=\textsf{1}}\alpha_k \times MTI_k - \sum^\textsf{6}_{k=\textsf{1}}\beta_k \times \sqrt{MTI_k \times MTI_{k+\textsf{1}}} \] | |||||||
Table A.1 -- MTI octave band weighting factors
| Frequency (Hz) | 125 | 250 | 500 | 1000 | 2000 | 4000 | 8000 | |
| Males | α | 0.085 | 0.127 | 0.230 | 0.233 | 0.309 | 0.224 | 0.173 |
| β | 0.085 | 0.078 | 0.065 | 0.011 | 0.047 | 0.095 | - | |
Table A.2 -- Auditory masking as a function of the octave band level
| $\small{L_{k-1}}$ - Sound pressure level (dB) of $\small{(k-1)}$ -th octave band |
< 63 | ≥ 63 and < 67 | ≥ 67 and < 100 | ≥ 100 |
| $\small{L_{a,\,k}}$ - Auditory masking (dB) of $\small{k}$ -th octave band |
$\scriptsize{0.5 \times L_{k-1} -65.0}$ | $\scriptsize{1.8 \times L_{k-1} -146.9}$ | $\scriptsize{0.5 × L_{k-1} -59.8}$ | $\scriptsize{-10}$ |
Table A.3 -- Absolute speech reception threshold level in octave bands
| Octave band centre frequency (Hz) | 125 | 250 | 500 | 1000 | 2000 | 4000 | 8000 |
| Absolute speech reception threshold (Sound pressure level) $\small{A_k}$ (dB) | 46 | 27 | 12 | 6.5 | 7.5 | 8 | 12 |
Table A.4 -- Octave band levels (dB) relative to the A-weighted speech level
| Octave band (Hz) | 125 | 250 | 500 | 1000 | 2000 | 4000 | 8000 | A-weighted |
| Males (dB) | -2.5 | 0.5 | 0 | -6 | -12 | -18 | -24 | 0.0 |